
NYC Evictions Are Below the National Average, and Lower Than You Think
The eviction rate is a fraction of a percent, and in some housing sub-segments like public housing it's essentially 0%.

How many evictions actually happen in NYC each year, and does NYC compare to other places? It’s not as easy to figure out as you might expect, and Googling it will likely mislead the average person.
The reality is that New York City has far fewer evictions than many people think—about 8,900 so far in 2025, in a city of about 2.3 million renter households.1 If we reach 15,000 by the end of the year, evictions will have affected about .7% of renter households. This is well below the national average, and has been for a while.
So what makes it hard to get a good grip on how many evictions happen in NYC? Three things:
People define “eviction rate” in different ways, and those ways are not always equal to “out of all the renting households in the city, how many get evicted?”
Data presentation: academics and activists often show an “eviction total” that is not equal to “how many evictions happened.” It will often be how many eviction cases were filed instead, which is often at least a factor of ten larger than the number of evictions.
While many people in the policy space are well intentioned, some are not, or they are poor communicators. If evictions go down, for example, they do not temper their messaging accordingly; and if they go up, they are not benchmarked well. This has two bad effects: (1) policy isn’t tailored to the scope or nature of the problem, and (2) people think reality is worse than it is, because they don’t know that NYC’s eviction rates are in the relative tank. The second point is especially egregious—it is a terrible thing to mislead someone into unwarranted pessimism. And the second point is easy to do, because it’s easy to mislead with data when it comes to evictions, as I indicate in the two points above.
I’m going to do four broad things in this post:
Get into the two points above in more detail
Compare New York City’s eviction rate to other places around the country
See what else we can learn with the eviction data. Can we answer the question “Do evictions happen disproportionately in rent regulated housing?” My answer: we can partially answer that, and it doesn’t seem to.
Ask for further data, and exhort the policy world to do a few things.
1) Data presentation skews perceptions of evictions—toward overestimation
This manifests primarily in two ways. The first is in the definition of “eviction rate,” and the second is in which data are presented or easily accessible to the public.
The definition of “eviction rate” is important, and variable
The numerator and denominator of this rate, or ratio, greatly impact whether it is seemingly higher or lower. The numerator is usually executed evictions (evictions actually carried out).
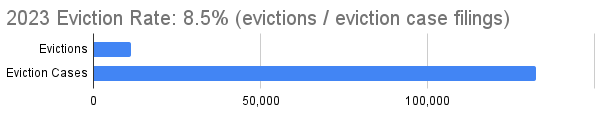
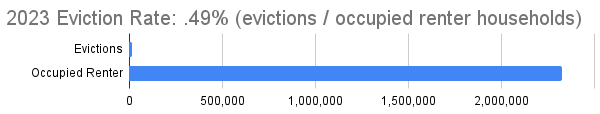
But the denominator could either be the number of eviction cases filed in court, or the total number of occupied renter households in a jurisdiction. So “eviction rate” either means “ratio of evictions to eviction filings” or “ratio of evictions to the number of renter households.” They’re both fine pieces of data, but: (1) people often assume “eviction rate” means something like the second definition when it often means the first, and (2) the first will always yield a dramatically higher “rate,” since court filings are often at least one factor of ten smaller than total occupied renter households in NYC.
For example: if you want to calculate NYC’s eviction rate by (executed evictions/court filings) for 2023, you’d get (11,305/132,550), or 8.5%.
If you want to calculate NYC’s eviction rate by (executed evictions/occupied renter households) for 2023, you’d get (11,305/2,324,000), or .49%.2
There are other ratios that exist throughout eviction literature that will land somewhere between these two.
So if you say something like “NYC’s eviction rate in 2023 was 8.5%,” most people assume by default that this means something like “that’s how many people/households were evicted.” But no! And while places like Eviction Lab do a great job of explaining their definitions that often use smaller denominators and result in higher rates—if you read their papers, there’s no question—it’s easy to see how excerpts of their work will leave the wrong impression. So you have to ask yourself: how many people are reading their actual posts, as opposed to sharing excerpts?
Academics and activists often publish eviction court filings, and not executed evictions, and rarely the two side-by-side
I started my research process the standard way, by Googling “NYC eviction rate,” just to see what popped up. The eviction rate (evictions versus number of households) did not; instead, most of the reports I got back were data on “eviction filings,” like this one from Princeton’s Eviction Lab. By default, most people who look into evictions will likely get filing numbers back first, with no obvious indication about how many of those convert into carried out evictions. It’s easy to see eviction filing numbers that are deliberately stylized (strong euphemism) to lead their viewer away from reality.
Because eviction filings are just that—filings, paperwork filed by a landlord to commence an eviction proceeding. Filings aren’t carried out evictions, which is what I wanted to know about. And I knew they weren’t indicative of actual evictions, because I saw that NYC had over 170,000 eviction filings in 2019. Since the average household size in NYC is about 2.55 people3, that (via napkin math) could mean 433,500 people evicted in one year. That sounded completely implausible on its face.4
So I abandoned Google and just went to New York City’s OpenData portal, searched “evictions,” and found exactly what I was looking for: a “dataset [that] lists executed evictions within the five boroughs for the years 2017-Present.” This is data entered by city marshals, who carry out evictions, and compiled by the city’s Department of Investigation.5
From here it was just a matter of exporting the data and cleaning it, and I had the answer to my initial question: how many evictions happen in New York City. But I had cultivated a hangup; the popular internet sources for eviction data did not usually discuss executed evictions, just filings, and rarely did they compare NYC to other places to benchmark. Getting an eviction filing is not a pleasant event in an individual’s life by any means, but it is also not nearly the same thing as actually being evicted. This hit my “people are not being shown the full picture” nerve. Citizens and policymakers need to see the whole picture of an issue, especially one as important as evictions.
So I graphed eviction filings, eviction warrants (warrants issued but not necessarily carried out), and executed eviction warrants (actual evictions) against each other to see how they compare.
The upshot: between 2019–2025 (6.5 years) there were 711,939 eviction filings in NYC.6 There were 55,720 executed evictions.7 For every 100 eviction filings in those years, there were about 7.8 executed eviction warrants.
And so far in 2025, as of July 31, there have been 62,735 eviction filings and 8,874 executed evictions.
Next is what these numbers look like if you zoom into one borough, The Bronx, although every borough’s graph lines have the same shape over time [get the data I compiled for all boroughs]. COVID essentially ended evictions across the city for ~2 years, but do note: the number of evictions that are completed relative to filed is always small. There have been about 3,000 evictions in The Bronx in 2025 as of July 31.
What else is behind the data you see? Orders to restore and other factors that could push the eviction numbers even lower
When you look at the number of formal evictions carried out, the numbers are pretty low compared to the number of eviction cases filed. But they could be lower still. For example: if someone has been evicted, a judge can issue an order to restore to possession. Or sometimes, when a city marshal goes to carry out an eviction, they find out that no one is home, maybe they have passed away, or something else. Not every executed eviction creates the “marshal comes and removes a person/people and their stuff8 from an apartment” scenario, or one that sticks. In the case of orders to restore to possession, we need another data series in the charts above that is “executed evictions net of orders to restore,” and maybe even another one below that that subtracts evictions executed on apartments with no one living in them.
At the same time, some research expands the definition of “eviction” beyond legal, executed eviction warrants, with a term called “forced moves.” This includes moving for reasons like an intolerable rent increase, or a variety of other factors. While I think that’s fine research, I also think it’s no longer talking about the brass tacks of “how many evictions happen in NYC,” which is what this piece is all about. “Forced moves” is a distinct category that includes evictions, and is a superset of them.9
I would love to see more research from the eviction/housing world on how many evictions are later reversed by orders to restore, or how many were executed on apartments with no one living there. Is it 1%? 10%? 25%? This is incredibly material data, and could significantly alter our answer to the question “How many evictions happen in NYC?” if what we’re actually looking for is “How many times does a marshal come to an apartment and remove people and their things in a permanent fashion?”
Questions to ask when you see eviction data:
What are the numerator and denominator of the “eviction rate” being presented?
What is being aggregated? Eviction filings? Eviction warrants issued? Evictions executed? Something else?
What other factors can influence these final numbers, if they are indeed final numbers? Orders to restore to possession and other factors are relevant in pushing numbers down.
2) New York’s eviction rate is far below the national average.
Note: Keeping in mind that words like “eviction rate” vary in their definition, I will generally say when it means “evictions per occupied renter households.” Otherwise the good assumption is that is means “evictions per filed eviction cases.”
While nationwide eviction data isn’t easy to collect, the average eviction rate (evictions versus occupied renter households) seems to hover around 2-3%. This number comes from Eviction Lab data collection from 2000-2016. This is a large average in time and scale, but it’s a useful directional baseline that New York limbos under with ease. Our eviction rate in 2017 was about .89%,10 and has hovered between that and ~0% from 2017-2025. You can calculate it yourself; just take the number of evictions per year and divide it by the number of occupied renter households in NYC (~2,340,000 as of 2023. For other years, look to the Housing and Vacancy Survey or the Department of City Planning).11
In several subsequent posts, Eviction Lab sharpens New York City’s comparatively low eviction rate from multiple angles.
When looking at eviction cases filed in court (which is a directional proxy for how many evictions actually get carried out, as we can see from the previous section in this post), they saw that places like New York tended to have lower filings rates:
These estimates help confirm trends documented in our original map, including that eviction filing rates are consistently highest in the Southeastern United States. Some of the highest annual eviction filing rates are observed in Maryland, South Carolina, and Georgia, challenging conventional understandings of eviction risk as primarily a concern of high-cost or high-population metropolitan areas.
When comparing “Change in average monthly [eviction] filings between pre- and post-pandemic baselines,” they found that New York City led in reductions:


When comparing top-line numbers of eviction cases in areas they track,12 Eviction Lab notes that the drop they noticed relative to previous years was driven almost entirely by New York City (which, keep in mind, was not coming from a much higher baseline than the other places either):
Landlords filed just over one million eviction cases in 2024 in the jurisdictions we track. That’s a small drop relative to 2023 and roughly seven percent fewer eviction cases filed than in a typical pre-pandemic year (see Figure 1). However, it’s notable that this reduction in eviction filings is driven by just one site: New York City. If we remove New York—the city with the largest renter population of the country—eviction filings were three percent above historical average.


And finally, this post’s title says it all: “In the most expensive city in the country, evictions remain lower than before COVID-19.” And again, keep in mind that NYC’s eviction rates were falling from a pre-COVID rate that was already below the national average. We’ve had substantial policy changes that impact evictions since 2019, but our eviction rates were comparatively low even prior to that.
3) We do not yet have enough evidence to fully say whether evictions disproportionately affect market or rent-regulated units, but what we do have suggests they could be close to proportionate
Background on the data behind answering this question
First thing’s first: I don’t have all the information I’d need to definitely answer the question “Are rent-regulated and market-rate apartments affected by evictions at the same rate, given their proportions of the housing stock.” The biggest missing piece is an official list of all rent-regulated apartments by address, which does not exist at the city or state level, and the public data we do have is incomplete [I think the public release of this dataset should be a joint city-state priority for many reasons]. Rent-regulated units are distributed unevenly throughout our rental stock, and any one apartment’s rent regulation status could have changed many times over the years.
Despite this, there are still proxy measurements one can use to get at this question, the best one being building size. Since most rent regulation kicks in for buildings that have six units or more, you can use evictions by building size to start getting an answer to the question of eviction proportionality between market and rent-regulated units.
So I merged two datasets: the evictions dataset from NYC’s OpenData portal, and the city’s Primary Land Use Tax Lot Output (PLUTO) dataset, which contains the number of residential units per tax lot [[See this explanatory note13 on using tax lots, since each can have more than one building]]. This allowed me to see how many residential units were on the tax lot of each evicted address. If there were five or less, that eviction was most likely a market-rate eviction. If there were six or more, it could have been rent-regulated, market, or public housing. So right away we’re splitting the question into two sub-questions:
Are evictions proportional in small buildings, which are mostly market-rate (≤5 units)?
Are evictions proportional in large buildings (≥6 units), which contain almost all rent regulated units, as well as public housing and the rest of the market-rate units?
Answering the two sub-questions: eviction proportionality in small and large buildings, as a proxy for evictions in market and rent-regulated buildings
To do this, let’s first see how NYC’s rental stock is divided between small and large buildings.
Using data from the 2023 NYC Housing and Vacancy Survey14, we know the occupied rental stock is divided about like this:
1-5 units, 24.8%: 575,890
6+ units, 60.9%: 1,416,000
Condo/coop, 14.3%: 331,400
But I will make a simplifying assumption: the exceedingly vast majority of condos and coops are in larger building in the 6+ category, which gives us this total:
1-5 units, 24.8%: 575,890
6+ units (including condos/coops): 75.2%: 1,747,000
Because almost all rent-regulated units are in buildings that are 6+ units, I can further transform the totals above to this:
1-5 units, 24.8%, ~all market rate: 575,890
6+ units (including condos/coops), a mix of non-market and market that includes ~all rent stabilized units: 75.2%: 1,747,000
Now let’s see how that compares to evictions by building size, using my merged eviction and PLUTO dataset. I got this breakdown of evictions from 2019-2025 by building size:
1-5 units, 22.5%: 12,539 (this is likely a slight undercount, see footnote 12)15
6+ units (includes ~all condos/coops), 69.6%: 38,77716
Unknown, not labeled in PLUTO, 7.9%: 4,40317
The unknown quantity could be treated as +0-7.9% to either of the top two values, but multiple random samples of the data paired with manual building lookups indicate they are probably ~all in the 6+ unit category. That simplifies to:
1-5 units, 22.5%: 12,539
6+ units (includes ~all condos/coops), 77.5%: 43,180
So it looks like small buildings, which are about a quarter of the rental stock as of 2023 and almost all market-rate, also carried about a quarter of the evictions averaged over 2019-2025. This also means large buildings carried a near-proportionate amount of evictions.18 This is a directional indicator that market-rate units as a whole might carry a proportionate (or nearly so) amount of evictions.
Well, what about rent-regulated units in large buildings? Do they carry a proportionate amount of evictions? It’s harder to tell, because “large buildings” have rent-regulated units, market units, and public housing (NYCHA) units. Large buildings as a whole have a near proportionate eviction rate, and we can know which evictions happened in those buildings—but we can’t yet be sure which of those units are market or rent-regulated. As I mentioned above, there’s no good public dataset for that.
Fortunately, we can solve parts of this puzzle, and directionally gesture at others.
Thanks to a city comptroller’s audit from December of 2024, we know that a rounding error’s worth of evictions occur in public housing units, which are in large buildings. So evictions happen in those units at an extremely disproportionately low rate. See:
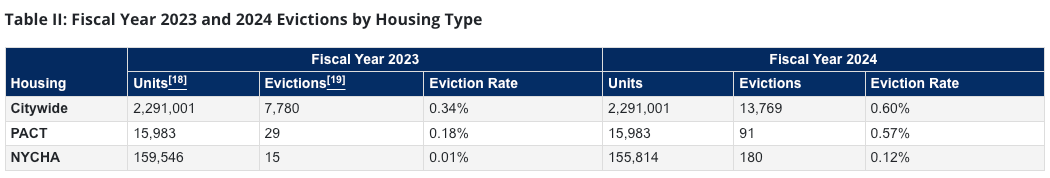
This audit report is also one of the relatively few places where NYC’s eviction rate (evictions / occupied rental units) is explicitly laid out, showing that it is well below 1%, even across different housing subsets.
What else do we know?
Rent-regulated units are mostly not distributed by income, especially those built before 1974, which is most of those units (post-1973 is different). So, as we have all seen recently in the news, you could have people earning quite a lot of money in those apartments. That population would tend to have a lower eviction rate, and would pull the rent-regulated eviction rates down overall compared to if rent-regulated housing was just for poorer New Yorkers.
The likely best survey that we have on forced moves (“moves due to eviction (formal or informal), building foreclosures, building sales, and building condemnations”) shows that, of those who move, 15% of moves from market-rate housing are “forced,” and 22% of moves from rent-regulated housing are “forced.”19 The survey was conducted prior to COVID and was self-reported by movers, so I only take it as “directional” rather than “definitive,” but it shows that even considering a definition much larger than pure evictions, there is not a gulf between forced moves in rent-regulated and market housing.
Final conclusions on eviction proportionality in market and rent-regulated units
Combined, my estimate of evictions in rent-regulated units comes to this: it seems very plausible that evictions happen in a proportionate way from those units. I’m sure if you broke evictions in rent-regulated buildings down by income, you’d see higher evictions in lower-income units, which would also mean seeing more evictions in the Bronx especially (which we do indeed see). What would this mean? Evictions don’t track market or rent-regulated status as much as just income status.20 Is there a policy implication? Yes. If you want to stop evictions, the surprisingly low amount people pay for rent isn’t the primary lever to pull (e.g., rent regulation)—what people have in their pocket to pay that rent seems like the more likely lever (e.g., vouchers—and the new housing supply necessary for vouchers to work). If it were about what people were charged for rent, you’d see more evictions in the areas with the highest rents, but we see the opposite.
4) Conclusions and data requests
First: If you want to know how many evictions happen in New York City, you will have to do some digging. The data you’re likely to encounter first will be rates of eviction court filings, not executed evictions themselves. Further complicating this: people use the word “eviction rate” in different ways, not all of which equate to “how many households are forcibly removed from their apartment by a city marshal?”
Second: the rhetorical environment to the contrary notwithstanding, NYC has a pretty low eviction rate, in both absolute and relative terms. It alone tends to be responsible for the nationwide drop in eviction case filings we’ve seen since COVID. Why is this the case? That’s a separate discussion that isn’t the focus of this post, but you can find a start of that conversation here. (I still anticipate many comments about how this post doesn’t discuss the 2019 rent law changes, but that is just not the point of the post.)
Third: if you want to know more detailed information about evictions, like how they impact market-rate versus rent-regulated housing, you will have to use proxy measures and directional reasoning to get at your answer. Until then, we need more data, and I hope someone in the housing/eviction world provides it—the city and state comprollers seem well placed to drive this, although the whole advocacy ecosystem should take a hard look. What do we need?
A public dataset of all rent-regulated units.
A breakdown of executed evictions in city housing court, based on how many were conducted on apartments without anyone living there, and how many were later reversed by an action like an order to restore.
An answer to this question: how many evictions in a city like New York is “normal,” and indicates that we’re not in any kind of emergency? Zero would not be normal—you will always have people who don’t pay their rent just because they don’t want to, or bad tenants who ruin apartments and need to be gotten out of them. But I don’t think I’ve seen anyone ever estimate a policy goal here, which means people can continue to use the same talking points about eviction even as the rate continues to go up or down; as I mentioned at the top, this has two bad effects: (1) policy isn’t tailored to the scope of the problem, and (2) people will think reality is worse than it is, because they don’t know that NYC’s eviction rates are probably lower than they imagine. I’m sure the policy goal would be between 0-1% somewhere (evictions / occupied renter households)—but that’s where NYC is and has been for a while! In public housing, we already are at essentially 0%.
Further reading
“Evictions Up, Representation Down: How New York City is Undermining the Right to Counsel,” NYC Comptroller, Bureau of Policy and Organizing (May 2025).
PLUTO Data Dictionary, 25v2 (June 2025).
“EVICTIONS: National Data Are Limited and Challenging to Collect,” United States Government Accountability Office (February 2024).
“Charting Homelessness in NYC,” NYC Comptroller. The title aside, this page tracks the number of eviction filings and executed evictions in NYC. But it is not widely distributed!
Explore the website of The Eviction Lab at Princeton.
Data & Methods
External data I used
State Landlord Tenant Eviction Dashboard, from the Unified Court System Division of Technology and Research (skip to dashboard) (updated July 28, 2025)
New York City OpenData, “Evictions” (updated July 31, 2025)
New York City Primary Land Use Tax Lot Output (PLUTO), 25v2 (updated June 2025)
Datasets I generated from the datasets above to do my analysis
Executed Evictions in NYC, 2017-2025 (2025 as of July 31), joined to PLUTO data, which was used to produce most of the numbers in this post (Daniel Golliher, Maximum New York).
Eviction court filings versus issued warrants versus executed warrants in NYC, for residential (non-payment, holdover) evictions, from 2019-2025 (2025 as of July 31). I compared these numbers going back to 2019 because that was how far back state court records went on their dashboard (Daniel Golliher, Maximum New York).
Methodological notes
Most of the choices I made about cleaning data, or explaining why I used certain numbers, are found directly in the text of this report when I use the numbers themselves; several times you will need to look at a footnote to get the full story.
If you have any questions about how I arrived at a number, you can also download the data I used directly to manipulate it for yourself. If you still cannot replicate it, send me a note (daniel@maximumnewyork.com). Together we will get a more accurate picture of evictions in New York City. I look forward to seeing what you add. Ever deeper data analysis allows us all get a better picture of the story.
You can find this information in New York City’s 2023 Housing Vacancy Survey initial findings (pages 6-7). If you wonder why I don’t use the total amount of occupied households in New York City, which is about 3.4 million, it’s because the other 1.1 million are owner-occupied. They are not evicted, but rather foreclosed upon. That’s a different dataset, and a different issue.
The number of occupied renter households in 2023 can be found in Table 2 of the 2023 NYC Housing and Vacancy Survey, on page 7.
“Declines in Household Size & Ramifications for Growth: New York City, 2010 to 2020,” New York City Department of City Planning, Population Division (January 14, 2022).
This bakes in several assumptions, like the average household size for the whole city (rather than a more granular household size for renters, which I couldn’t find a good estimation of). Further: multiple filings could be directed at the same household, although that didn’t seem to be very common. Regardless, I think the napkin math holds.
The city’s sheriff also carries out evictions (the sheriff is nested within the city Department of Finance), but building owners use marshals to carry out evictions almost exclusively. I have a FOIL request out for exact sheriff data, but I don’t expect it to change the analysis. Sheriffs focus on property seizure itself, rather than evictions. And if it does change the analysis, that would be quite surprising to everyone, including the city and state comprollers! But if you think it will, I will be happy to take the other side of that bet in a formal, public bet.
See “Eviction Filings” tab in NYC Eviction Data, as of July 31, 2025 [RESIDENTIAL, NON-PAYMENT & HOLDOVER]--(Daniel Golliher, Maximum New York), compiled from the New York State court system.
See “Eviction Warrants Executed” tab in NYC Eviction Data, as of July 31, 2025 [RESIDENTIAL, NON-PAYMENT & HOLDOVER]--(Daniel Golliher, Maximum New York), compiled from the NYC OpenData Portal.
Depending on how the process is carried out, a property owner might be in charge of retaining and cataloging belongings for some period of time.
See: “Spotlight On: Forced Moves and Eviction in New York City: A first look at the experiences and trajectories of New Yorkers who are forced out of their housing,” Robin Hood (May 2019). This is probably the most up-to-date survey on “forced moves” that NYC has, but please send me more work if you know of it!
.89% was calculated by dividing the total number of executed evictions in New York City in 2017 (~18,700) and dividing it by the total number of occupied renter households as of 2017 (2,103,874, from the 2017 Housing Vacancy Survey, p.2).
Data for 2025 goes through July 31, 2025, since that is when I last pulled it from the city’s OpenData portal.
From their post: “Through our Eviction Tracking System (ETS), the Eviction Lab monitors the rate at which new eviction cases are filed in 10 states and more than 30 cites nationwide. Places included in the ETS are home to roughly one in every three renter households. The court data that we collect lets us keep tabs on housing instability in real time—to understand how many people face the threat of eviction, where they live, and who they are. In this brief, we present a review of trends over the last year (you can read our previous report here).”
[[Explanatory note on using tax lots: A tax lot can have more than one building on it, and this could potentially make a difference for our building size analysis. For example: what if you had two buildings and seven residential units on a tax lot? You could theoretically have two situations: (1) six units in one, one unit in the other, with the six-unit building potentially being rent stabilized, or (2) three units in one, four in the other, with neither likely being rent stabilized. If you want to use PLUTO’s “unitres” field (the number of residential units per tax lot), also need to filter by how many buildings are on each tax lot. This lets you see how many buildings fall into over the “potentially rent-stabilized” horizon. For simplicity’s sake, I just tabulated all addresses on tax lots with five or fewer buildings to give me a rough count of small buildings that were almost certainly market rate. This number is undercounted, but not by much.]]
The number of occupied renter households broken down by type in 2023 can be found in Table 2 of the 2023 NYC Housing and Vacancy Survey, on page 7.
How to calculate evictions in buildings with 1-5 units, using “tax lots with 5 or fewer residential units” as a proxy that will slightly undercount: see the pivot table in the “# buildings on tax lot vs ≤5 res units” tab of Executed Evictions in NYC, 2017-2025, joined to PLUTO (Daniel Golliher, Maximum New York). The grand total in the bottom right is 12,992, from which I subtracted all unit counts that were 0, and all building counts that were 0. This yields 12,539.
How to calculate evictions in buildings with 6+ units, using “tax lots with 6 of more residential units” as a proxy that will slightly overcount: see the pivot table in the “unknown # res units on tax lots” tab of Executed Evictions in NYC, 2017-2025, joined to PLUTO (Daniel Golliher, Maximum New York). The grand total in the bottom right is 38,777.
How to calculate evictions in buildings with an unknown or unlabeled amount of units, using “tax lots with 0 or blank units”: see the pivot table in the “# buildings on tax lot vs ≥6 res units” tab of Executed Evictions in NYC, 2017-2025, joined to PLUTO (Daniel Golliher, Maximum New York). Sum all buildings with a building and/or unit count of 0, and all with no label, and you get 4,403.
If you think the ratio of small buildings to large buildings changed significantly from 2019-2025 in a way that affects this analysis, do let me know. But I don’t think it did.
Even if you did see a wildly disproportionate amount of evictions coming from rent-regulated apartments, if your rent-regulated stock is income agnostic (as New York’s mostly is), then you can’t immediately tie rent regulation status to eviction likelihood—you’re probably just tracking income levels. That we don’t immediately see a sharp divide in evictions based on regulation status sharpens this point even more.
Spectacular math and reasoning, as always!