
The Role of Market-Rate Rental Housing in New York City
Front, center, left, and right

Discussing the role of market-rate rental housing in New York City can be difficult for a few reasons:
Most people do not know basic facts about the market-rate rental housing stock—past or present—but aren’t even aware of this. Their conversations never go there, and are abstracted away from the real context of NYC’s housing stock.
“Market-rate housing” triggers a strong emotional response, and many people respond from that point of view alone. This is usually counterproductive if your goal is to get to the truth of housing policy with someone.
“Market-rate housing” is polarized. No matter what you say about it, people will recite their ideological creed in response, and it will almost certainly be a textbook case of either the is-ought political trap or the is-therefore political trap. Regardless, they are not responding to you or trying to commune with reality.
The goal of this post is to address the first bullet above, and outline some important anchor facts about the market-rate housing stock that can help orient people in policy discussions.
The points I’ll lay out aren’t the only important facts about New York City’s market-rate stock, nor are they the end of the conversation. But, in my experience, they can help people avoid 85% of intellectual and policy dead-ends right off the bat:
Two-thirds of NYC’s housing stock is renter-occupied, one-third is owner-occupied.
Most of NYC’s rental housing is not market-rate, and hasn’t been for about 80 years.
Most of NYC’s housing was originally market rate.
New York’s rent regulation laws explicitly state that our housing crisis is caused by a lack of private (market) residential construction.
The last—and only—time NYC exited a legal housing crisis, it was by enabling massive market-rate housing construction.
What is market-rate rental housing?
For the purposes of this post, “market-rate” rental housing is housing where the owner can legally set the cost of rent with no, or extremely little, limitation. That’s it. If you want to use a different definition, that would change the analysis of this post, but I want to interpret the term as broadly as possible. If you have a different definition—write your own post!1 Also, unless indicated otherwise, phrases like “market-rate housing” or “housing market” refer to rentals only.
“Market-rate rental housing” is distinguished from both non-market rental housing, and non-rental housing of any kind—which brings me to my introductory housing stock fact: about two thirds of NYC’s housing is rental, and one-third is owner-occupied.
Per the New York City Rent Guidelines Board’s “2024 Housing Supply Report (page 4):
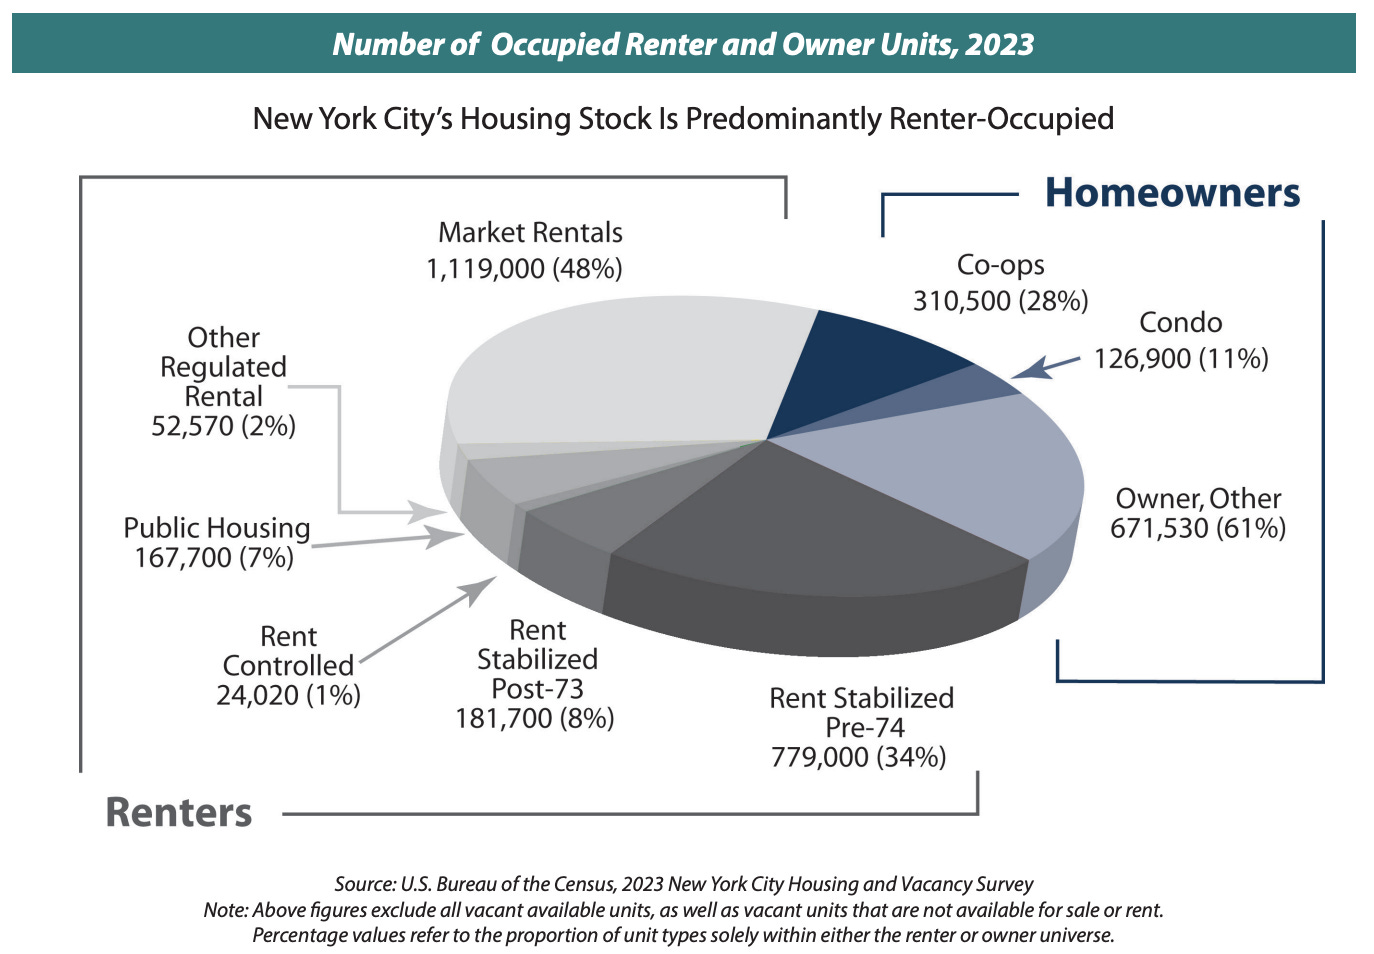
Notes on reading this chart: the percentages you see are not the percentage of all housing, but the percentage of either rental or owned housing. For example: “Co-ops, 310,500 (28%)” means that, of all owner-occupied homes, co-ops are 28%. This doesn’t mean there can’t be rental co-ops too, but they would be included under one of the rental categories. Another example: “Market Rentals, 1,119,000 (48%)" means that, of all housing for rent (which does not include anything in the “Homeowners” part of the chart), market rate rentals are slightly less than half. The underlying data for the chart disaggregates this much further.The graphic above can also give you a high-level overview of the many subcategories within “renter” and “owner.”Most of NYC’s rental housing is not market-rate, and hasn’t been for about 80 years
“New York City’s housing market” is an ironic phrase, because most of our rentable housing is not market-rate, and it hasn’t been for a very long time. You can see it in the chart above, but you can also see it in the data from the city’s Housing and Vacancy Surveys (HVSs), which are generally conducted every three years.
I compiled this data from HVSs going back to 19912:
If you’re wondering why I only went back to 1991, instead of 1965 when the HVS began, it’s because the HVS labelled its data differently up until 1991. “Market rate” (or private, unregulated) was not its own category. “Market rate” rental housing was either lodged in an “other” category that included various things, or was simply called “decontrolled” to show that it was not subject to rent control at the time. Why? Because market-rate housing was a small portion of the housing stock! The vast majority of New York City’s rental housing stock has been non-market since rent regulation began in the 1940s.
Most of NYC’s housing was originally market rate
Generally speaking, housing production in New York City has followed this broad arc: people build market-rate housing, and then that housing gets rent regulated by the government.
There are tons of exceptions to this trend in both directions3, but you can verify the trend by looking at the history of rent regulation. Jason Barr recently published a great overview.
New York’s rent regulation laws explicitly state that we need more market-rate supply to end the housing crisis
I wrote a whole separate post about this that walks you through the law itself. But the top-level points the law clearly states are:
The housing emergency is fundamentally caused by a lack of housing supply.
The housing emergency is specifically caused by a lack of private residential supply.
The goal of rent regulation is to be a bridge back to a primarily market-based rental system.
The last—and only—time NYC exited a housing crisis, it was by enabling massive market-rate housing construction
I could tell you the story, but instead I’ll quote An Introduction to the New York City Rent Guidelines Board and the Rent Stabilization System (pp.19-20, emphasis added):
The Emergency Rent Laws of 1920 were adopted in the wake of dramatic increases in dispossess proceedings and a collapse in new construction caused by a diversion of resources to the [first world war] effort…
The housing shortage of the early 1920’s was severe. Vacancy rates fell below 1% from 1920 through 1924. To induce new construction, the City exempted all properties built between 1920 to 1926 from property taxation until 1932. In addition, all units constructed after September 27, 1920 were exempt from the rent laws. Notwithstanding the presence of relatively strict rent protections for existing units, new construction proceeded at a record pace, with hundreds of thousands of new apartments being added to the stock before the decade ended. By 1928 the City’s vacancy rate was approaching 8% and rent regulations were no longer needed. A phase out began in 1926 in the form of luxury decontrol – exempting units renting for more than $20 per room per month. After 1928 apartments renting for $10 or more, per room, per month were excluded. The Rent Laws of 1920 expired completely in June 1929, although limited protections against unjust evictions were continued.
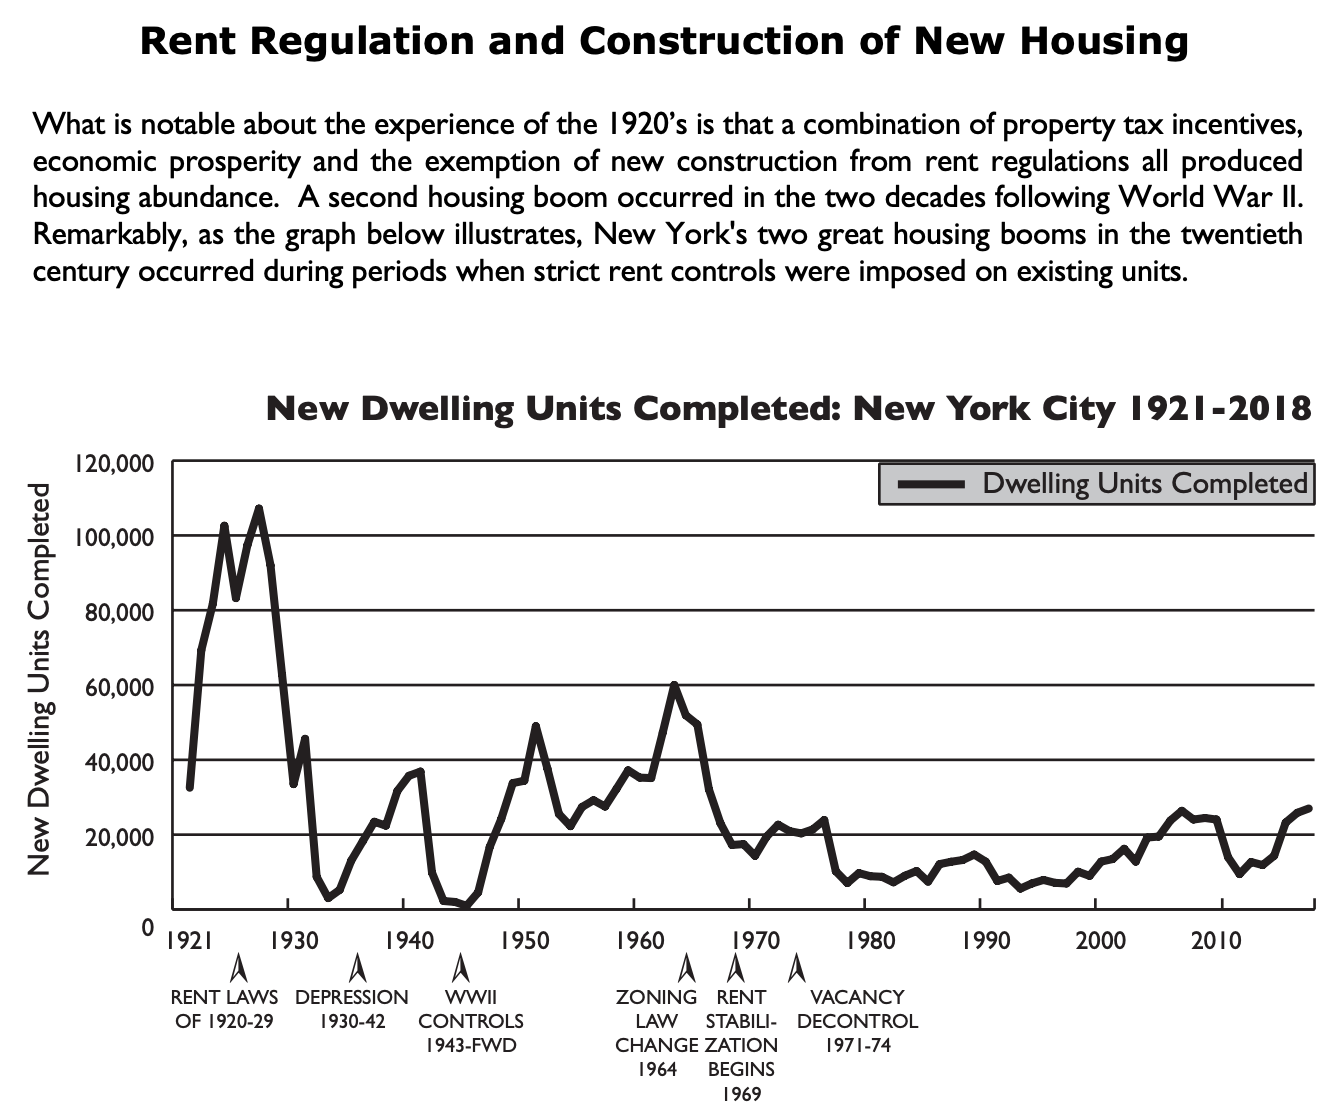
Chart 1 (below) from the same publication also makes an interesting thing clear: you can have massive market rate housing construction,4 and strict rent regulations. The government just needs to structure policy correctly, and it can thread the political economy of a housing shortage and rising rents. Our policy balance today will look different from the 1920s, but it’s doable.
Concluding notes
If you want to answer the question “What is the role of market-rate rental housing in New York City’s housing stock?” you could do it in a few ways. My personal take:
It’s how we got the vast majority of our housing, and it still is.
Nonetheless, New York City’s rental “housing market” has been majority non-market rate since WWII.
The future of housing abundance, and solving our supply (and corresponding affordability) crisis, rests primarily with the city’s ability to produce market-rate housing—as the rent regulation and housing emergency laws clearly state, and as the experience of the 1920s rental crisis demonstrate.
Recognizing the empirical reality about market-rate rental housing in New York City does not require opposing non-market housing—the two can go together, and have throughout our history.5 Getting the balance right is essential. We do not currently have the balance right.
Market-rate housing is good, and the people who build it are providing most people in the city with one of their most fundamental needs—just like market-rate groceries, electronics, clothes, and more. They need help, not popular derision.
For example, some people might (and do) say that any/all laws limiting the ability of a landlord to evict someone make something not “market-rate.” I am not taking that position in this post.
The 1991 data was actually provided in the 1993 report, which helpfully reorganized the 1991 HVS data into categories compatible with post-1991 reports. Further, the U.S. Census, which conducts the Housing and Vacancy Survey for New York City, changes its methodology over time. This sometimes means that they make backwards revisions in their data—but this is all public, and you can read their methodology and play with the data yourself. If you go through the HVSs yourself, you should note that my chart uses 2014’s revised data for 2011 (not a huge change, but notable—see Table 3 in the 2014 HVS).
The single largest exception to this is probably the ~170k units within the New York City Housing Authority, which are public housing, and not market rate.
“But, Daniel, the government gave the housing built in the boom of the 1920s a complete property tax break. That’s not market-rate housing, that’s government favoritism!”
First of all: please recall my definition of “market-rate housing” from the top of the piece. I define it as housing where the owner can set the price of rent without legal limit. That’s it. This type of response is trying to sneak in another definition that has to do with housing finance and tax policy. My definition of market-rate housing includes every form of tax treatment, and is about how housing is sold, not how it is financed. As I say up top, if you want to use a different definition, write your post with your own data.
Second of all: all markets are shaped by government and law. Government defines and enforces property rights, taxes, and many other things that shape a market. The sneaky thing about responses like the one above is they tend to imply that “market rate” means “no influence of government, including taxes, etc”—but all property almost definitionally is influenced by government as we know it. These kinds of responses are mostly incoherent, and are not useful when you’re actually trying to craft policy.
Acknowledging the central role of rental market-rate units is not an argument against public development. You can do both, and there is a role for both. One of the most important roles government has played historically is housing preservation. During the 1970s especially, NYC lost hundreds of thousands of units to mass abandonment or dereliction. The city’s population fell by about one million in one decade. So the city set up the administrative infrastructure to rehabilitate and preserve that stock, which had many great benefits. See this historical overview from the “Housing and Vacancy Report: New York City, 1991” (p.6):
New residential completions in 1991 fell to a recession-induced 6-year low of 7,639 units. This is 36 percent below the 5-year average of annual completions experienced during the 1987-91 period (12,012 units/year), and 26 percent lower than the average for the entire 1981-91 period (10,276/year).
In many housing markets new construction is the dominant source of net new additions to the stock. This is not the case in New York City. In 1991 alone, more apartments—7,800—were rehabilitated by the City’s Department of Housing Preservation and Development than were newly built in the entire City.
City-sponsored programs added an unprecedented 20,360 newly constructed or gut-rehabilitated units to the inventory between July 1987 and June 1991.
There were 130,000 units lost since 1970 that did not return to the active inventory by 1987 but still had the potential to return because they had not been demolished. Of these 130,000 units, 31,000 returned to the inventory between April 1, 1987 and December 1990. In addition to these returned losses, another 11,000 previously lost units were in the process of being rehabilitated or newly constructed. Thus, the total number of returned and returning units between April 1987 and December 1990 is 42,000 or an average of 11,000 per year.”
Excellent post! Useful to highlight that the 1920s controls exempted new construction. If they hadn't, that boom would have much more limited.